Case study
Financial Reporting Dashboard
Automated data collection and transformation feeding clear Power BI management reporting.
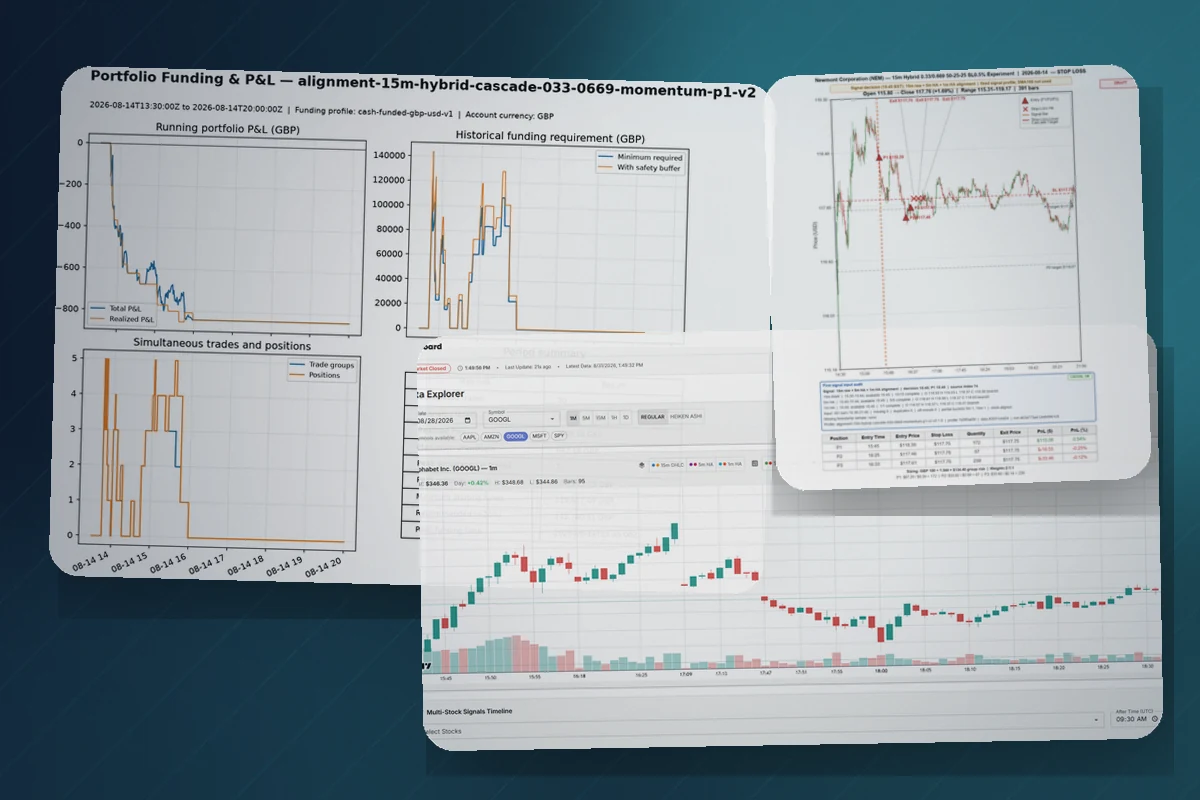
The challenge
- Financial figures were assembled by hand across spreadsheets, which was slow and easy to get wrong.
- Data came from more than one source and needed consistent transformation.
- Leaders needed timely, trustworthy reporting to make decisions.
The approach
- Agreed the trusted data sources and the decisions the reporting needed to support.
- Built Python and SQL data collection and transformation with documented logic.
- Validated the figures against known values before the reporting went live.
The solution
- Automated data collection and transformation pipelines.
- Power BI reporting presenting consolidated KPIs.
- Scheduled refreshes to keep reporting current without manual work.
Outcome
- Manual spreadsheet effort was reduced and consistency improved.
- Reporting became timely and repeatable.
- Transformations were documented so the pipeline could be maintained.
Technologies
- Python
- SQL
- Power BI
Related services
Interested in similar work?
Tell us about your project and we will share how we would approach it.