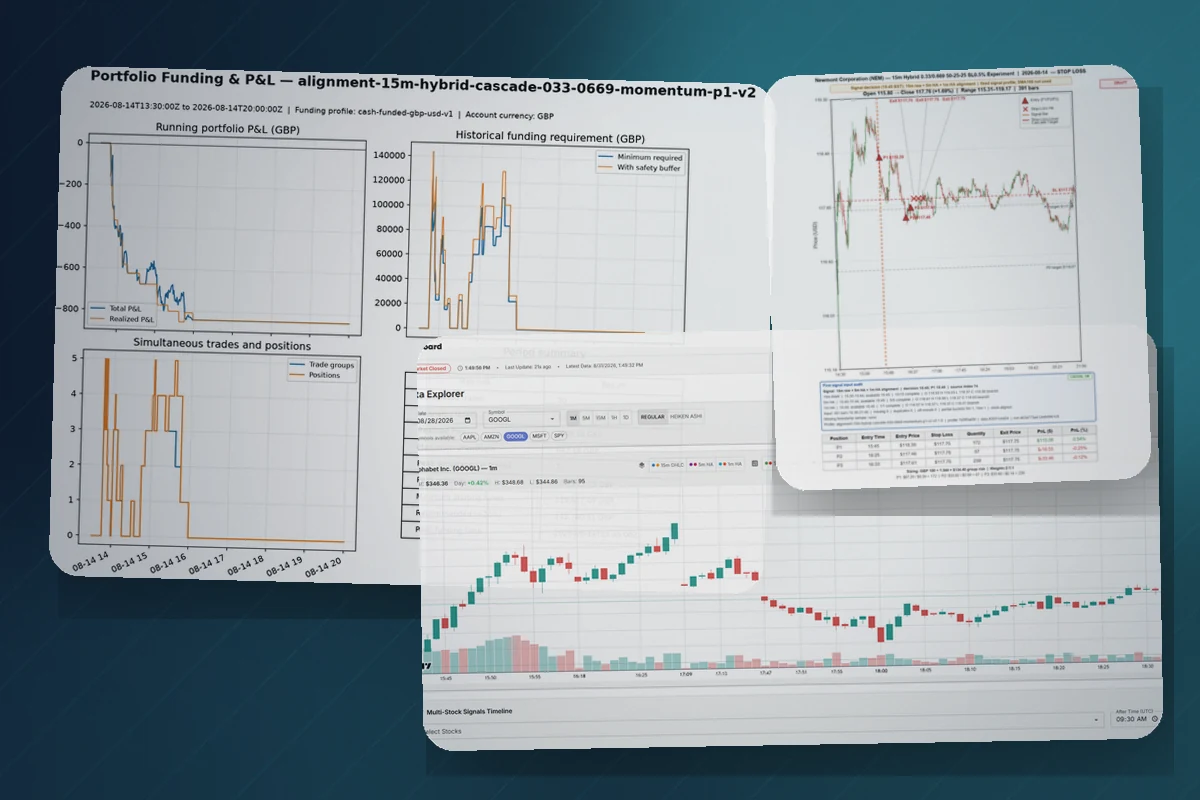
Financial Reporting Dashboard
Financial reporting relied on manual spreadsheet work that was slow and error-prone.
Outcome: Automated pipelines fed consistent Power BI reporting, reducing manual effort and errors.
- Python
- SQL
- Power BI
Service
Reporting and dashboards that bring scattered data together into clear, trustworthy management information.
Problems we address
Capabilities
Example solutions
Delivery approach
Agree the decisions the reporting must support and the trusted data sources.
Define the data model, transformations and dashboard layout.
Build, validate the numbers, launch and automate refreshes.
Supporting evidence
Tools are chosen to fit the problem. This is supporting evidence, not the main sales message.
Related work
Financial reporting relied on manual spreadsheet work that was slow and error-prone.
Outcome: Automated pipelines fed consistent Power BI reporting, reducing manual effort and errors.
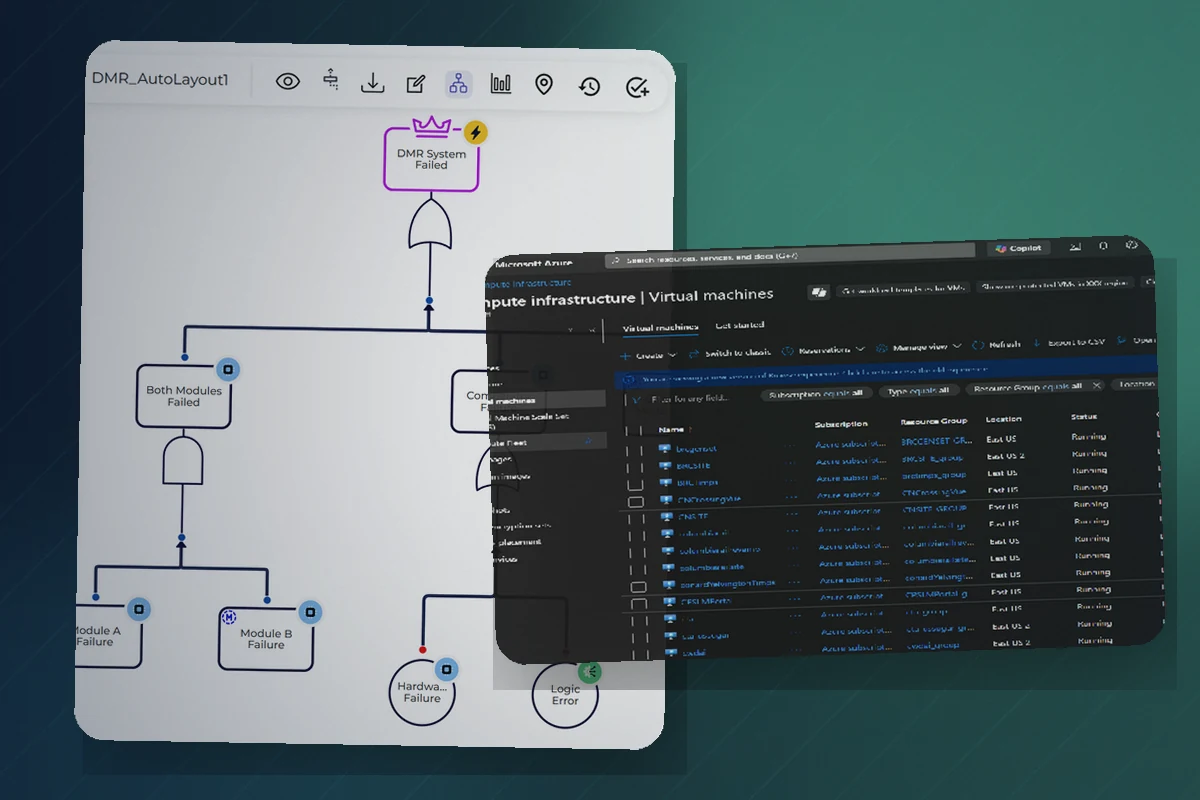
Equipment records in SAP and spatial asset layers in ArcGIS could not be viewed or reconciled together.
Outcome: A reconciled, mapped view connected enterprise equipment data with its real-world location.
FAQ
Yes. Existing tools are used where they fit. A custom React dashboard is only recommended when it adds clear value over an off-the-shelf option.
Sources are agreed up front, transformations are documented and figures are validated against known values before launch.
Yes. Data collection and transformation can run on a schedule so dashboards and exports stay current without manual work.
Tell us what you are trying to achieve and we will suggest a sensible first step.